Research
Job Market Paper
Where the Windfall Lands: Export Booms and the Demand for Democracy in Africa
Working paper (Last updated November 2026)
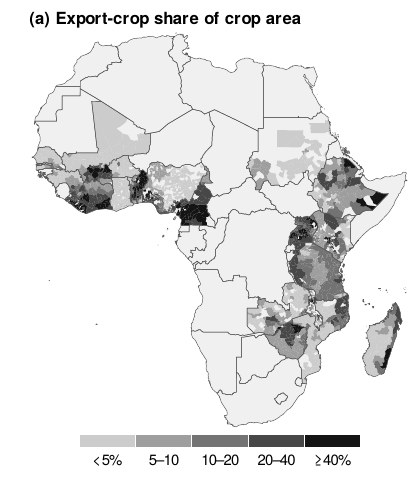
Export booms can increase household resources or strengthen dependence on benefits controlled by the state. I examine their relationship with democratic demand across African districts where farming is more or less common. The analysis links fixed crop maps and world prices to 125,659 Afrobarometer respondents in 22 countries between 2005 and 2022. With country-round fixed effects and expected-exposure controls, a one-standard-deviation three-year boom has a fitted demand response 0.025 standard deviations more positive where the district farming share is 25 percentage points higher. Crop-history tests allowing an unknown common linear boom effect give probabilities of 0.061 in the full sample and 0.042 without Mali’s post-coup survey; neither rejects at the 10 percent level after adjustment across the control comparisons. These post hoc tests require exchangeable price histories and valid fixed conditioning information. Additional controls and cotton exclusion leave positive but uncertain estimates. Aligned area-level consumption comparisons do not verify an accompanying resource gain. Consumption is imputed and not jointly observed with attitudes, leaving income transmission unresolved. The geographic pattern makes the distribution of potential export gains relevant to democratic preferences, while remaining compatible with both household independence and geographically unequal state benefits.
Working Papers
Mapping Africa’s Middle Class Across Space
with Tobias Heidland
Working paper (Last updated November 2026)
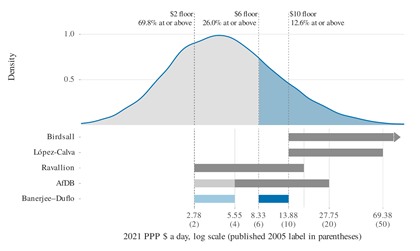
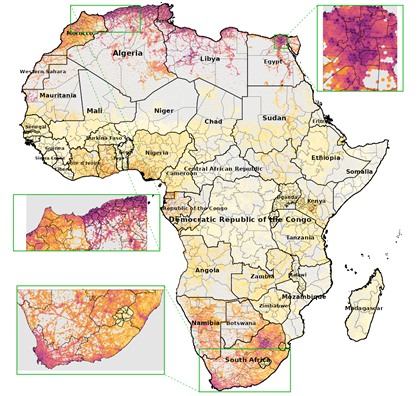
We provide the first highly granular mapping of the African middle class. Using incomes from the Gallup World Poll to calculate subnational middle-class shares in 45 countries between 2015 and 2023, infrastructure, night lights, population, and gridded measures of output and wealth, we then use a machine learning approach to predict shares for 159,698 populated cells. In leave-one-country-out cross-validation, the model explains 72 percent of the regional variation in the share of people living on $2–10 a day and 62 percent for $10–100 a day. Our approach cannot predict relative definitions well. We find that 20.2 percent of Africans fall in the $2–10 band and 2.6 percent in the $10–100 band. Two-thirds of both groups live within 300 km of the coast. Both are concentrated in regions where aid disbursements are small relative to GDP.
Under Review
Preparing for FX Intervention
with Tobias Heidland and Lukas Menkhoff
Journal of Money, Credit and Banking, Revise and Resubmit (Last updated November 2026)
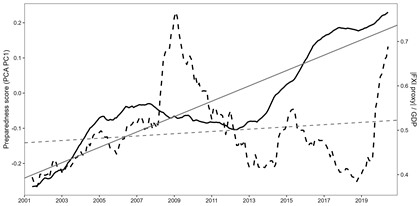
Most central banks do not publish their foreign exchange interventions (FXI), but the preparations that enable their interventions are visible. We measure FXI preparedness through three policy decisions, namely the rigidity of the exchange rate regime, the level of official reserves and the share of reserves held in assets available for intervention. For the last of these, we build a new index from the IMF’s data on reserve composition. Better-prepared countries intervene more, so preparedness indicates a willingness to intervene where intervention data are not published. Between 2001 and 2020, preparedness rose with more rigid regimes and larger reserves, while aggregate intervention did not keep pace. Preparedness is higher in economies with lower income, greater trade openness and more volatile portfolio inflows.